Economic Development Resources
Download Full PDF Version of Report with Button Below Download Report
(Undergoing Update) On this page, you will find a demographics report provided by our partners Lone Star College North Houston Economic Development Center. The report has data and information on the topic sections found below. Click each section button to be sent directly to that data.

Population & Demographics


Economic Indicators


2020 Statistic


2020 Statistic

2020 Statistic

2020 Statistic


2020 Statistic


Wage Trends

As of 2023Q2, total employment for the NHA Service Area was 740,512 (based on a four-quarter moving average). Over the year ending 2023Q2, employment increased 3.2% in the region.

The average worker in the NHA Service Area earned annual wages of $74,092 as of 2023Q2. Average annual wages
per worker increased 7.5% in the region over the preceding four quarters. For comparison purposes, annual average
wages were $70,318 in the nation as of 2023Q2.


Upcoming Events

-
April 2025 Environment Committee Meeting *Members Only*
April 18, 2025
11:30 am - 1:00 pm

-
May 2025 Development Committee Meeting *Members Only*
May 6, 2025
7:45 am - 9:00 am

-
May 2025 Transportation Committee Meeting *Members Only*
May 7, 2025
11:30 am - 1:00 pm
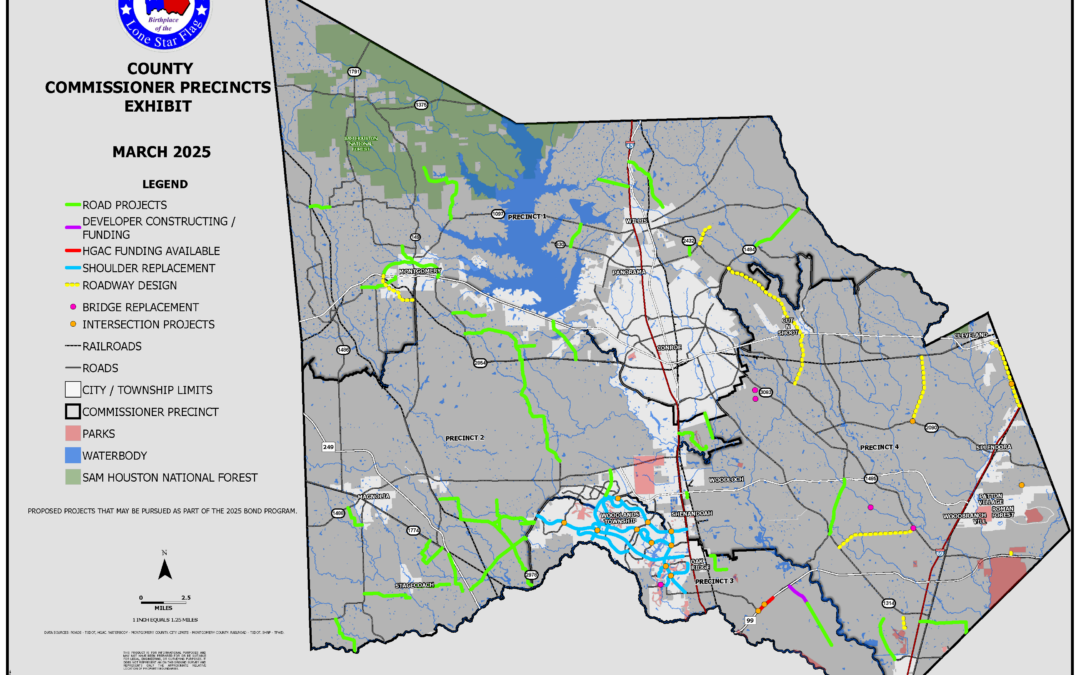
NHA Supports the 2025 Montgomery County Road Bond
BOARD OF DIRECTORS Kim Sachtleben, PEChairPape-Dawson Engineers, Inc. Dan Kolkhorst, PEVice ChairThe Howard Hughes Corporation Jeanne JullienTreasurerUES Robb Fishman AICP/REMSecretaryKCI Technologies, Inc. Ed Shackelford, PEImmediate Past ChairSan Jacinto River...

Affordability in Texas Master Planned Communities: Key Insights from the April 1st NHA Developer’s Breakfast
On April 1st, the North Houston Association (NHA) held its much-anticipated Developer's Breakfast, offering a deep dive into the ongoing challenges and opportunities surrounding affordable housing in Texas. The event featured a panel discussion with experts from...

NHA Staff Enjoys An Opportunity to Attend National Community Development Institute (CDI)
Economic and community development representatives from across the nation participated in the Texas Community Development Institute (CDI Texas) March 3-7. Among those completing Year 1 of the three-year program was NHA Membership Engagement and Marketing Manager,...
Career Star is Lone Star College’s job placement website for students and alumni which is specifically focused on their degree programs. On Career Star, you can create and post a resume. You can also search and apply for jobs and internships.
View over 70 Associate of Applied Science degrees. View the latest Career Focus Magazinetrends and the new across Lone Star College.
Student Employment Services
Get a jump start to your job search process! Career counselors and workforce advisors are there to help you develop successful tips on writing your resume, preparing for interviews, and searching for a job. Employment opportunities wait to be discovered by you.
Employers – Recruit a Student
Looking for employees? Lone Star College offers employment resources to for employers to recruit potential applicants. Post your job opening for students, alumni and the community. Or sign up to attend upcoming job fair events.
Cost of Living Index
The Cost of Living Index estimates the relative price levels for consumer goods and services. When applied to wages and salaries, the result is a measure of relative purchasing power. The cost of living is 5.7% lower in NHA Service Area than the U.S. average.

Industry Snapshot


Over the next 1 year, employment in the NHA Service Area is projected to expand by 9,184 jobs. The fastest growing sector in the region is expected to be Management of Companies and Enterprises with a +2.3% year-over-year rate of growth. The strongest forecast by number of jobs over this period is expected for Health Care and Social Assistance (+1,422 jobs), Professional, Scientific, and Technical Services (+908), and Accommodation and Food Services (+904).


The largest sector in the NHA Service Area is Retail Trade, employing 85,025 workers. The next-largest sectors in the region are Accommodation and Food Services (74,726 workers) and Health Care and Social Assistance (73,947). High location quotients (LQs) indicate sectors in which a region has high concentrations of employment compared to the national average. The sectors with the largest LQs in the region are Mining, Quarrying, and Oil and Gas Extraction (LQ = 7.19), Transportation and Warehousing (1.78), and Construction (1.51).


Sectors in the NHA Service Area with the highest average wages per worker are Management of Companies and Enterprises ($231,176), Mining, Quarrying, and Oil and Gas Extraction ($220,354), and Utilities ($149,238). Regional sectors with the best job growth (or most moderate job losses) over the last 5 years are Transportation and Warehousing (+13,881 jobs), Professional, Scientific, and Technical Services (+9,024), and Health Care and Social Assistance (+8,337).
Education & Employment Growth

Expected growth rates for occupations vary by the education and training required. While all employment in the NHA Service Area is projected to grow 1.2% over the next ten years, occupations typically requiring a postgraduate degree are expected to grow 1.8% per year, those requiring a bachelor’s degree are forecast to grow 1.6% per year, and occupations typically needing a 2-year degree or certificate are expected to grow 1.6% per year.


CenterPoint URD Information
![]()